- The topics reflected in this chart may arise from voluntary disclosures or from mandatory reporting requirements in different jurisdictions. Accordingly, no conclusions should be drawn solely from observed trends.
- Results are based on options provided in the survey and are not exhaustive nor necessarily indicative of when the industry first started producing the topical report.
- In 2016 (when the question first appears) - there were 4 subtopics being used as extra communications: country/regional reports; energy/climate; payments to governments and human rights.
- The number of topics provided in the survey and the number of 'others' specified by respondents increases every year.
- Climate change remains a consistently popular choice - as does scenario analysis and Modern Slavery Statement.
The annual Ipieca sustainability reporting survey highlights emerging practices and developments in the sustainability reporting practices of Ipieca member companies. The purpose is to enable member companies to learn from their peers, and improve industry communication about sustainability issues. The survey results also feed the continued development of the Ipieca, API, IOGP Sustainability reporting guidance for the oil and gas industry.
This interactive dashboard presents highlights from the most recent survey, as well as analysis of all survey results since 2012, allowing for year-on-year comparisons which highlight reporting trends and changing priorities across the industry.
Please note: As this is a voluntary survey, not all Ipieca members participate and company participation varies each year. Survey questions have also evolved over the years in accordance with shifting stakeholder expectations, changing regulatory landscape and member priorities. Direct comparisons are therefore not available for every question, nor do all comparisons cover every year. Users should keep this in mind when drawing conclusions from the results.
To download a chart as an image, right-click on the chart and click Download Image on the menu that appears.
Sustainability reporting in the industry
The oil and gas industry has a long history of sustainability reporting.
Oil and gas companies were among the first companies to produce standalone reports on safety and environmental issues in the 1990s.
The below chart shows a timeline of when Ipieca members produced their first reports, signposting the formation of Ipieca’s Reporting Working Group and the editions of Ipieca’s Sustainability reporting guidance, first published in 2005.
Graph 1: Timeline of first sustainability reports produced by Ipieca members (based on Ipieca membership as of November 2024)
You can interact with the charts by hovering on the data points or bars to view specific information, such as exact values or percentages.
Milestones
2003 - Formation of Ipieca Reporting Working Group
2005 - Ipieca-API Oil and gas industry guidance on voluntary sustainability reporting
2010 - 2nd edition - Ipieca-API-OGP Oil and gas industry guidance on voluntary sustainability reporting
2015 - 3rd edition - Ipieca-API-IOGP Oil and gas industry guidance on voluntary sustainability reporting
2020 - 4th edition - Ipieca-API-IOGP Sustainability reporting guidance for the oil and gas industry
2025 - 5th edition - Ipieca-API-IOGP Sustainability reporting guidance, with just transition indicators
100% of Ipieca corporate and associate members produce reports/online content about their sustainability performance.
Companies publish sustainability performance information every year. The 2024 reporting survey shows that 66% of the responding companies have done so for 10 or more years.
Graph 2: Number of years reporting on ESG information (2025 survey result)
Graph 2: Number of years reporting on ESG information (2025 survey result)
The scope of additional topical reports has broadened considerably over the past 20-30 years.
These days, the suite of corporate sustainability reports frequently include topics such as climate change, community engagement, security and human rights, water, local content, biodiversity, or disclosures addressing the needs of stakeholders in specific locations and regions.
Graph 3: Number of topics selected for additional reports/communications per year
Click on a topic below to see which years it was the focus of additional reports/communication
Scenario analysis/energy industry outlook
| Years |
|---|
| 2017 |
| 2018 |
| 2019 |
| 2020 |
| 2021 |
| 2022 |
| 2023 |
| 2024 |
| 2025 |
Country/regional reports
| Years |
|---|
| 2016 |
| 2017 |
| 2018 |
| 2019 |
| 2020 |
| 2021 |
| 2022 |
| 2023 |
| 2024 |
| 2025 |
Climate change and transition plans
| Years |
|---|
| 2016 |
| 2017 |
| 2018 |
| 2019 |
| 2020 |
| 2021 |
| 2022 |
| 2023 |
| 2024 |
| 2025 |
Tax Transparancy Report
| Years |
|---|
| 2016 |
| 2021 |
| 2022 |
| 2023 |
| 2024 |
| 2025 |
Human rights
| Years |
|---|
| 2016 |
| 2017 |
| 2018 |
| 2019 |
| 2020 |
| 2021 |
| 2022 |
| 2023 |
| 2024 |
| 2025 |
Water
| Years |
|---|
| 2017 |
| 2018 |
| 2019 |
| 2020 |
| 2023 |
| 2024 |
| 2025 |
Biodiversity
| Years |
|---|
| 2018 |
| 2019 |
| 2020 |
| 2021 |
| 2022 |
| 2023 |
| 2024 |
| 2025 |
Modern slavery statements
| Years |
|---|
| 2018 |
| 2019 |
| 2020 |
| 2021 |
| 2022 |
| 2023 |
| 2024 |
| 2025 |
UN Global Compact
| Years |
|---|
| 2019 |
| 2020 |
| 2021 |
| 2022 |
| 2023 |
| 2024 |
| 2025 |
Voluntary Principles
| Years |
|---|
| 2019 |
| 2020 |
| 2021 |
| 2022 |
| 2023 |
| 2024 |
| 2025 |
EITI
| Years |
|---|
| 2019 |
| 2020 |
| 2021 |
| 2022 |
| 2023 |
| 2024 |
| 2025 |
SDGs
| Years |
|---|
| 2019 |
| 2020 |
| 2021 |
| 2022 |
| 2023 |
| 2024 |
| 2025 |
Diversity, pay equity, human capital
| Years |
|---|
| 2020 |
| 2021 |
| 2022 |
| 2023 |
| 2024 |
| 2025 |
Trade associations review
| Years |
|---|
| 2022 |
| 2023 |
| 2024 |
| 2025 |
Just transition
| Years |
|---|
| 2023 |
| 2024 |
| 2025 |
Community investments
| Years |
|---|
| 2023 |
| 2024 |
| 2025 |
Supply chain
| Years |
|---|
| 2024 |
| 2025 |
Circular economy
| Years |
|---|
| 2024 |
| 2025 |
Animal testing
| Year |
|---|
| 2025 |
Country/regional reports
| Years |
|---|
| 2016 |
| 2017 |
| 2018 |
| 2019 |
| 2020 |
| 2021 |
| 2022 |
| 2023 |
| 2024 |
| 2025 |
Climate change and transition plans
| Years |
|---|
| 2016 |
| 2017 |
| 2018 |
| 2019 |
| 2020 |
| 2021 |
| 2022 |
| 2023 |
| 2024 |
| 2025 |
Tax Transparancy Report
| Years |
|---|
| 2016 |
| 2021 |
| 2022 |
| 2023 |
| 2024 |
| 2025 |
Human rights
| Years |
|---|
| 2016 |
| 2017 |
| 2018 |
| 2019 |
| 2020 |
| 2021 |
| 2022 |
| 2023 |
| 2024 |
| 2025 |
Scenario analysis/energy industry outlook
| Years |
|---|
| 2017 |
| 2018 |
| 2019 |
| 2020 |
| 2021 |
| 2022 |
| 2023 |
| 2024 |
| 2025 |
Country/regional reports
| Years |
|---|
| 2016 |
| 2017 |
| 2018 |
| 2019 |
| 2020 |
| 2021 |
| 2022 |
| 2023 |
| 2024 |
| 2025 |
Climate change and transition plans
| Years |
|---|
| 2016 |
| 2017 |
| 2018 |
| 2019 |
| 2020 |
| 2021 |
| 2022 |
| 2023 |
| 2024 |
| 2025 |
Human rights
| Years |
|---|
| 2016 |
| 2017 |
| 2018 |
| 2019 |
| 2020 |
| 2021 |
| 2022 |
| 2023 |
| 2024 |
| 2025 |
Water
| Years |
|---|
| 2017 |
| 2018 |
| 2019 |
| 2020 |
| 2023 |
| 2024 |
| 2025 |
Oil sands and unconventional gas
| Year |
|---|
| 2017 |
Scenario analysis/energy industry outlook
| Years |
|---|
| 2017 |
| 2018 |
| 2019 |
| 2020 |
| 2021 |
| 2022 |
| 2023 |
| 2024 |
| 2025 |
Country/regional reports
| Years |
|---|
| 2016 |
| 2017 |
| 2018 |
| 2019 |
| 2020 |
| 2021 |
| 2022 |
| 2023 |
| 2024 |
| 2025 |
Climate change and transition plans
| Years |
|---|
| 2016 |
| 2017 |
| 2018 |
| 2019 |
| 2020 |
| 2021 |
| 2022 |
| 2023 |
| 2024 |
| 2025 |
Human rights
| Years |
|---|
| 2016 |
| 2017 |
| 2018 |
| 2019 |
| 2020 |
| 2021 |
| 2022 |
| 2023 |
| 2024 |
| 2025 |
Water
| Years |
|---|
| 2017 |
| 2018 |
| 2019 |
| 2020 |
| 2023 |
| 2024 |
| 2025 |
Biodiversity
| Years |
|---|
| 2018 |
| 2019 |
| 2020 |
| 2021 |
| 2022 |
| 2023 |
| 2024 |
| 2025 |
Modern slavery statements
| Years |
|---|
| 2018 |
| 2019 |
| 2020 |
| 2021 |
| 2022 |
| 2023 |
| 2024 |
| 2025 |
UN Global Compact
| Years |
|---|
| 2019 |
| 2020 |
| 2021 |
| 2022 |
| 2023 |
| 2024 |
| 2025 |
Voluntary Principles
| Years |
|---|
| 2019 |
| 2020 |
| 2021 |
| 2022 |
| 2023 |
| 2024 |
| 2025 |
EITI
| Years |
|---|
| 2019 |
| 2020 |
| 2021 |
| 2022 |
| 2023 |
| 2024 |
| 2025 |
SDGs
| Years |
|---|
| 2019 |
| 2020 |
| 2021 |
| 2022 |
| 2023 |
| 2024 |
| 2025 |
Indigenous Rights Policy
| Years |
|---|
| 2020 |
| 2021 |
Diversity, pay equity, human capital
| Years |
|---|
| 2020 |
| 2021 |
| 2022 |
| 2023 |
| 2024 |
| 2025 |
COVID response plans
| Years |
|---|
| 2020 |
| 2021 |
| 2022 |
Scenario analysis/energy industry outlook
| Years |
|---|
| 2017 |
| 2018 |
| 2019 |
| 2020 |
| 2021 |
| 2022 |
| 2023 |
| 2024 |
| 2025 |
Country/regional reports
| Years |
|---|
| 2016 |
| 2017 |
| 2018 |
| 2019 |
| 2020 |
| 2021 |
| 2022 |
| 2023 |
| 2024 |
| 2025 |
Climate change and transition plans
| Years |
|---|
| 2016 |
| 2017 |
| 2018 |
| 2019 |
| 2020 |
| 2021 |
| 2022 |
| 2023 |
| 2024 |
| 2025 |
Tax Transparancy Report
| Years |
|---|
| 2016 |
| 2021 |
| 2022 |
| 2023 |
| 2024 |
| 2025 |
Human rights
| Years |
|---|
| 2016 |
| 2017 |
| 2018 |
| 2019 |
| 2020 |
| 2021 |
| 2022 |
| 2023 |
| 2024 |
| 2025 |
Biodiversity
| Years |
|---|
| 2018 |
| 2019 |
| 2020 |
| 2021 |
| 2022 |
| 2023 |
| 2024 |
| 2025 |
Modern slavery statements
| Years |
|---|
| 2018 |
| 2019 |
| 2020 |
| 2021 |
| 2022 |
| 2023 |
| 2024 |
| 2025 |
UN Global Compact
| Years |
|---|
| 2019 |
| 2020 |
| 2021 |
| 2022 |
| 2023 |
| 2024 |
| 2025 |
Voluntary Principles
| Years |
|---|
| 2019 |
| 2020 |
| 2021 |
| 2022 |
| 2023 |
| 2024 |
| 2025 |
EITI
| Years |
|---|
| 2019 |
| 2020 |
| 2021 |
| 2022 |
| 2023 |
| 2024 |
| 2025 |
SDGs
| Years |
|---|
| 2019 |
| 2020 |
| 2021 |
| 2022 |
| 2023 |
| 2024 |
| 2025 |
Diversity, pay equity, human capital
| Years |
|---|
| 2020 |
| 2021 |
| 2022 |
| 2023 |
| 2024 |
| 2025 |
COVID response plans
| Years |
|---|
| 2020 |
| 2021 |
| 2022 |
Affiliate/subsidiary report
| Year |
|---|
| 2022 |
Protected areas report
| Year |
|---|
| 2022 |
Trade associations review
| Years |
|---|
| 2022 |
| 2023 |
| 2024 |
| 2025 |
Methane
| Year |
|---|
| 2022 |
Scenario analysis/energy industry outlook
| Years |
|---|
| 2017 |
| 2018 |
| 2019 |
| 2020 |
| 2021 |
| 2022 |
| 2023 |
| 2024 |
| 2025 |
Country/regional reports
| Years |
|---|
| 2016 |
| 2017 |
| 2018 |
| 2019 |
| 2020 |
| 2021 |
| 2022 |
| 2023 |
| 2024 |
| 2025 |
Climate change and transition plans
| Years |
|---|
| 2016 |
| 2017 |
| 2018 |
| 2019 |
| 2020 |
| 2021 |
| 2022 |
| 2023 |
| 2024 |
| 2025 |
Tax Transparancy Report
| Years |
|---|
| 2016 |
| 2021 |
| 2022 |
| 2023 |
| 2024 |
| 2025 |
Human rights
| Years |
|---|
| 2016 |
| 2017 |
| 2018 |
| 2019 |
| 2020 |
| 2021 |
| 2022 |
| 2023 |
| 2024 |
| 2025 |
Water
| Years |
|---|
| 2017 |
| 2018 |
| 2019 |
| 2020 |
| 2023 |
| 2024 |
| 2025 |
Biodiversity
| Years |
|---|
| 2018 |
| 2019 |
| 2020 |
| 2021 |
| 2022 |
| 2023 |
| 2024 |
| 2025 |
Modern slavery statements
| Years |
|---|
| 2018 |
| 2019 |
| 2020 |
| 2021 |
| 2022 |
| 2023 |
| 2024 |
| 2025 |
UN Global Compact
| Years |
|---|
| 2019 |
| 2020 |
| 2021 |
| 2022 |
| 2023 |
| 2024 |
| 2025 |
Voluntary Principles
| Years |
|---|
| 2019 |
| 2020 |
| 2021 |
| 2022 |
| 2023 |
| 2024 |
| 2025 |
EITI
| Years |
|---|
| 2019 |
| 2020 |
| 2021 |
| 2022 |
| 2023 |
| 2024 |
| 2025 |
SDGs
| Years |
|---|
| 2019 |
| 2020 |
| 2021 |
| 2022 |
| 2023 |
| 2024 |
| 2025 |
Diversity, pay equity, human capital
| Years |
|---|
| 2020 |
| 2021 |
| 2022 |
| 2023 |
| 2024 |
| 2025 |
Trade associations review
| Years |
|---|
| 2022 |
| 2023 |
| 2024 |
| 2025 |
Just transition
| Years |
|---|
| 2023 |
| 2024 |
| 2025 |
Community investments
| Years |
|---|
| 2023 |
| 2024 |
| 2025 |
Supply chain
| Years |
|---|
| 2024 |
| 2025 |
Circular economy
| Years |
|---|
| 2024 |
| 2025 |
- Further Information
Reporting practices are dynamic and adaptable.
Reports are routinely provided in print and online, and in various formats or channels to meet the needs of users.
94% of responding companies now use social media to help convey Environmental, Social and Governance (ESG) content.
Graph 4: The social media channels companies use to convey ESG content (2025 survey result)
Graph 4: The social media channels companies use to convey ESG content (2025 survey result)
Integration of sustainability in corporate governance and assurance practices
The industry’s history of reporting has supported the establishment of robust governance processes around sustainability information.
Board directors or CEOs approve the main ESG disclosures in 75% of responding companies.
Executive compensation is now routinely linked to ESG performance, with particular focus on goals and targets relating to climate. 91% of responding companies link executive compensation to their organisation's ESG performance.
Compensation is also tied to other aspects of ESG performance beyond climate, such as safety, social, environment and governance.
Our member companies have also been at the forefront of developing approaches to third-party assurance.
In 2025, 94% of responding companies said they include some form of assurance of their ESG disclosures.
Graph 7: Percentage of survey respondents with some form of verification/assurance of their ESG disclosures
Materiality
Reporters have begun to develop 'double materiality' approaches in line with emerging regulatory requirements.
Materiality processes are formal processes for assessing which topics are most important to include and focus on in their sustainability reporting. 'Double materiality' requires companies to disclose information on significant sustainability matters from a financial perspective, an impact perspective, or both perspectives.
81% of responding companies have a formal materiality process in place.
On average, 60% of responding companies have double materiality processes in place (since 2022, when respondents were first asked about double materiality).
Graph 8: Percentage of companies with formal materiality processes in place
2025 survey result
Graph 9: Respondents with formal materiality vs double materiality processes
Sustainability topics
The scope of topics covered by sustainability reports has grown considerably over the past decade.
Disclosures are now widely made across environmental, social and governance topics in general, with increasing detail on particular subjects of importance to specific stakeholders.
The below graph shows the top 5 sustainability topics that responding companies anticipate holding the highest significance for the industry or their company over the next 3-5 years.
The external reporting landscape
The sustainability reporting landscape has changed significantly in recent years, with changes to long-established frameworks and the emergence of newer frameworks in areas such as climate reporting and nature.
As a result, reporters face a complex disclosure system, which includes national and international regulatory measures, national and global standards, voluntary measures and other frameworks supporting good practice. Reporters must therefore select the frameworks that best address their goals and which support them in their reporting.
The following reporting standards/frameworks/commitments have guided the development of responding companies' reports over the past 10 years.
Graph 12: Reporting standards/frameworks/commitments guiding development of sustainability reports each year
| Year | 2016 | 2017 | 2018 | 2019 | 2020 | 2021 | 2022 | 2023 | 2024 | 2025 |
|---|---|---|---|---|---|---|---|---|---|---|
| Total no. options provided | 7 | 11 | 10 | 14 | 15 | 15 | 15 | 19 | 23 | 24 |
| 1st | Ipieca-API-IOGP | Ipieca-API-IOGP | Ipieca-API-IOGP | Ipieca-API-IOGP | TCFD | Ipieca-API-IOGP | TCFD | TCFD | TCFD | Ipieca-API-IOGP |
| 2nd | GRI | GRI | GRI | GRI | Ipieca-API-IOGP | TCFD | Ipieca-API-IOGP | Ipieca-API-IOGP | GRI OG 11 | TCFD |
| 3rd | UNGC | UN SDGs | UN SDGs | TCFD | UN SDGs | GRI | UN SDGs | GRI (2021) | Ipieca-API-IOGP | GRI OG 11 |
| 4th | Ipieca Climate | Ipieca Climate | UNGC | UN SDGs | GRI | SASB | SASB | SASB | GRI (2021) | UN SDGs |
| 5th | UNGPs | TCFD | TCFD | Ipieca Climate | SASB | UN SDGs | Historic GRI | GRI OG 11 | UN SDGs | SASB |
| 6th | SASB | UNGC | Ipieca Climate | UNGC | Ipieca Climate | UNGC | UNGC | UN SDGs | SASB | GRI (2021) |
| 7th | IR | Global Reporting Initiative (GRI) Sector Disclosures | Directive 2014/95/EU | UNGC | WEF | GRI (2021) | UNGC | UNGC | CSRD and ESRS | |
| 8th | OECD | UNGPs | WRI-WBCSD | Directive 2014/95/EU | WEF | WRI-WBCSD | WRI-WBCSD | UNGC | ||
| 9th | VPSHR | Directive 2014/95/EU | VPSHR | WRI-WBCSD | Directive 2014/95/EU | CSRD and ESRS | ISSB/IFRS S2 | |||
| 10th | SASB | VPSHR | OGCI | VPSHR | OGCI | EU Taxonomy | EU Taxonomy |
- Further Information
- There is an increasing number of options to select from every year - this is most likely a reflection of more and more standards being developed, produced and pushed by investors each year.
- GRI and SASB dip and rise as they release updated and new standards and frameworks.
- The UN Sustainable Development Goals have been in the top 5 since they were launched, except in 2023 (when they come in 6th).
- Abbreviations
Abbreviation Standard CSRD and ESRS EU Corporate Sustainability Reporting Directive and European Sustainability Reporting Standards Directive 2014/95/EU Directive 2014/95/EU (for non-financial reporting) GRI Global Reporting Initiative GRI OG 11 Global Reporting Initiative Oil and Gas Sector Standard IR Integrated Reporting Framework Ipieca Climate Ipieca Climate Reporting Framework Ipieca-API-IOGP Ipieca-API-IOGP Sustainability reporting guidance for the oil and gas industry ISSB/IFRS S2 International Sustainability Standards Board - IFRS S2 Climate-related Disclosures OECD Organisation for Economic Co-operation and Development Guidelines for Multinational Enterprises OGCI OGCI Reporting Framework SASB Sustainability Accounting Standards Board sustainability accounting standards TCFD Task Force on Climate-Related Financial Disclosures recommendations UNGC UN Global Compact Ten Principles, Communication on Progress UNGPs UN Guiding Principles Reporting Framework UN SDGs UN Sustainable Development Goals VPSHR Voluntary Principles on Security and Human Rights Verification Framework WEF World Economic Forum - Stakeholder Capitalism Metrics WRI-WBCSD World Resources Institute - World Business Council for Sustainable Development GHG Protocol
The UN Sustainable Development Goals
As per the Ipieca Principles, Ipieca members support the UN 2030 Agenda for Sustainable Development, as embodied by the UN Sustainable Development Goals (SDGs).
Graph 13: Companies referencing the SDGs in their reporting
80% of 2025 respondents are reporting to/referencing the SDGs in their reports.
In their reporting, Ipieca members have sought to focus on opportunities where they can maximise their contribution to the SDGs.
These opportunities involve scaling up good practices in environmental and social performance and building on innovative partnerships.
When asked to prioritise the SDGs most relevant to their activities and impacts, SDG 7 (Affordable, reliable energy for all) and SDG 13 (Climate action) has ranked highest in 2025 survey, closely followed by SDG 8 (Decent work and economic growth).
SDG 3 (Good health and wellbeing) and SDG 9 (Industry, innovation and infrastructure) both make appearances in the top fourth or fifth position.
Graph 14: Top 5 priority SDGs per year
Click on an SDG icon to view trends over time
No Poverty
Zero Hunger
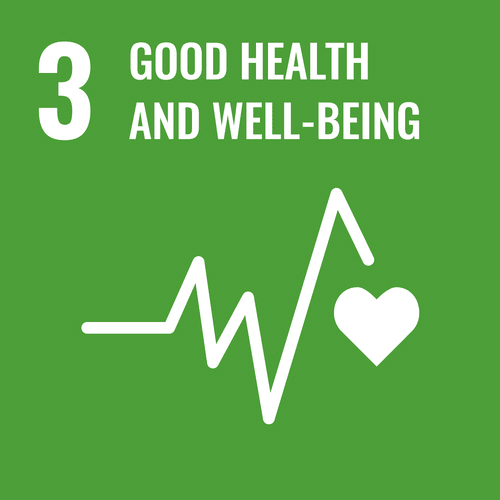
Good Health and Well-being
Quality Education
Gender Equality
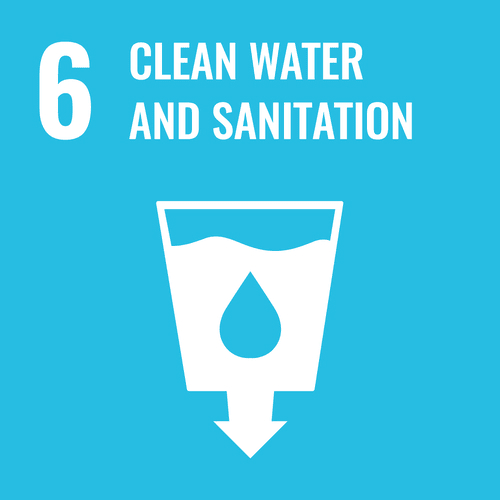
Clean Water
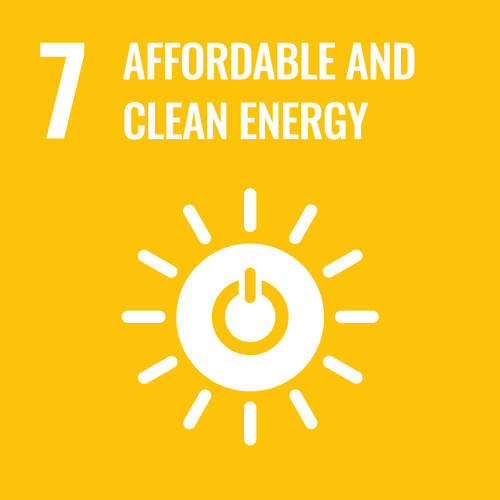
Affordable and Clean Energy
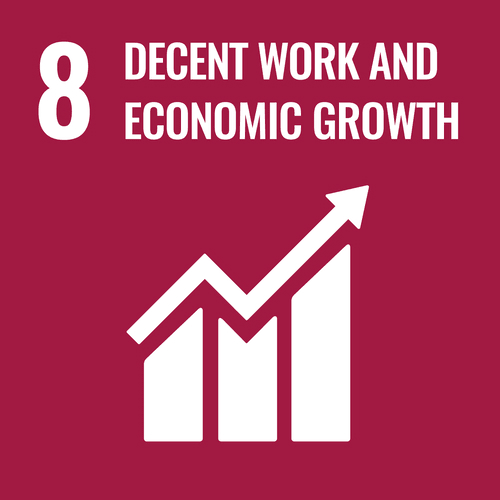
Decent Work and Economic Growth
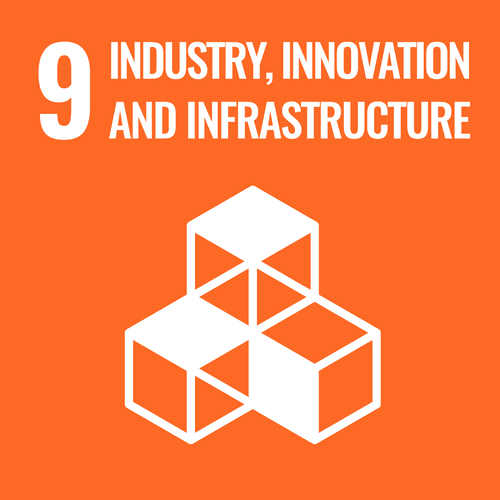
Industry, Innovation and Infrastructure
Reduced Inequalities
Sustainable Cities and Communities
Responsible Consuption and Production
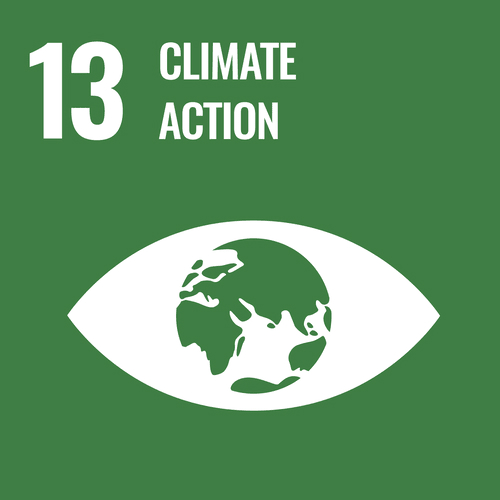
Climate Action
Life Below Water
Life on Land
Peace, Justice and Strong Institutions